None of the claims zackees is making are new or obscure. They're well known problems proven many years ago. For example so many thermometers are located next to runways because climatologists collect data from weather stations that were never intended for them. Airports need this data but then it gets mixed into datasets that are claiming to measure general change in climate.
This can lead to absurd outcomes. The UK had a very hot day last year, with the Met Office reported a "record breaking" temperature. The problem is that this temperature was recorded by a thermometer right next to a military airbase runway at the exact moment three fighter aircraft were landing. The temperature spiked up to the record level for 60 seconds and then dropped again, with the spike+drop being quite massive. Finding this out took a year of FOIA requests, done by independent bloggers of course, not journalists.
Jet exhaust shouldn't be reported as climate change, but it is, because climatologists don't seem to care much about data quality. The underlying networks they use have a lot of corruption in them from various sources and the error bars are wide, but the uncertainty is never reported or shown to the public.
A couple of decades ago this problem flared up in the US and Congress spent the money to build out a new state of the art weather station network just for climatologists, with very carefully sited stations. It's called the Climate Reference Network and climatologists refuse to actually use its data. If you review the thermometer readings it generates you can see why:
> This can lead to absurd outcomes. The UK had a very hot day last year, with the Met Office reported a "record breaking" temperature. The problem is that this temperature was recorded by a thermometer right next to a military airbase runway at the exact moment three fighter aircraft were landing. The temperature spiked up to the record level for 60 seconds and then dropped again, with the spike+drop being quite massive. Finding this out took a year of FOIA requests, done by independent bloggers of course, not journalists.
I'm going to need a source on this. This doesn't even really make sense to me, because a single 1s spike (in either direction) should be filtered out. It also doesn't make sense how this would significantly affect a model which is performing a multi-decade analysis unless that single 1s spike was used to represent at least a month's worth of temperature. Which as far as I know the data is being pulled at at least a daily rate if not more, so the spike would disappear.
For the "no warming" part, let's adjust things a little bit to be more clear. First, let's clear that noise. It is all jiggly and difficult to read and trend going on. Let's select the month of June (middle of the year) and then select a 12-month time scale. Interesting, the beginning and end have the same point. Let's now find out if this is a coincidence or not (current window should be 2006-2022). If we move our window to 2010-2022 we see a clear trend line up over the last decade, but it is noisy (-1.07 -> +0.96). So let's go in the other direction. 2000-2022 seems down, slightly. Let's keep going. 1990-2022, okay, very clear upwards. 1980-2022, very upwards. 1970-2022, we're now at -1.65 -> +0.96. 60's, seems we've stabilized. 50's, oh, difference is decreasing again. And we keep going and see a clear trend of increasing.
I think when we're talking about a multi-decade effect we need to look at... multiple decades and be a bit more careful to not only look at one single window. Especially with numbers jumping around a lot.
> 'm going to need a source on this. This doesn't even really make sense to me
I was in London all last summer, as I am now. You are correct. The idea that the record breaking temperature of 19 July 2022 (1) was some kind of fake or artifact of measurement, is horseshit, plain and simple. There's no other way to put it. This is a glib but nonsensical assertion. It's just deliberately wrong.
That 1 day was the worst of it but the whole several weeks were bad. I myself measured 41C in my back yard on the 19th. Others had similar.
OK here are the sources. Note that I said the spike was 60 seconds, not 1 second, not sure where you got a 1 second spike from. Re-reading the stories it seems it was more like a few minutes rather than one minute. Anyway, the RAF Coningsby investigation was done by Chris Morrison over the course of about a year. I suspect you or others will reject the source for ideological reasons, but here's how he developed the story. This brief spike mattered because it was widely covered in the UK as irrefutable evidence of climate change, it being the hottest temperature ever recorded there. It's not about inclusion in monthly averages.
It begins here, with the BBC lying about where the record temperature was observed. Not a great start:
"The BBC noted on Radio 4 last night that the record temperature arose in the “village” but co-ordinates on the Met Office site place the device halfway down the runway at RAF Coningsby, home of two squadrons of frontline, combat ready squadrons and a training base for Typhoon pilots."
Here's where they discover the record was set during a brief spike:
"Over six minutes, the temperature jumped suddenly by 1.3°C to 40.3°C at 15.12 (3.12pm), and was 0.6°C lower just a minute later. In just two minutes from 15.10 the rise was 0.6°C."
Here the Met Office claims that they have a rigorous verification process, and maybe a break in clouds was the reason for the spike, but Morrison got a satellite photo that showed it was a cloudless day:
Re: no warming. Someone else was confused by this, maybe my language wasn't clear enough. The US CRN only has data back to 2005 because that's when it was opened. The point is that the older network is garbage, with lots of heat-causing corruption in the record and very low data quality. Climatologists in the 1990s were drawing totally different temperature graphs to today's, yet they are both supposed to be based on the same observations. This is clearly a terrible situation to be in for any field, and a big driven of distrust in climatology. Good scientists care about instrument accuracy, they don't collect low quality data and then constantly rewrite the collected data in a never ending attempt to retroactively fix it! So if we restrict our view to the data collected by the trustworthy weather station network, what do we see? No warming at all, even though CO2 rose constantly over the time period in question. That's a serious problem and the attempts at debunking it aren't convincing.
So I'm not buying it from the articles. They are unconvincing and not really saying too much. They keep point back to satellite data and that surface temperature stations are biased. I actually addressed some of this in this comment[0]. The arstechnica article actually discusses a lot of this. We know that airport data is biased. No one has claimed otherwise. It's also why the data is pre-processed before being used. It doesn't make it garbage, it just makes it biased. If you know the direction it is biased, you can unbias it. I'm not sure what Watts is talking about and I can't read his report. Even using the wayback machine I can't load it. But if he did what he's saying he did then it looks like he just unbiased the debiased data, not the raw. The arstechnica post even goes through this btw.
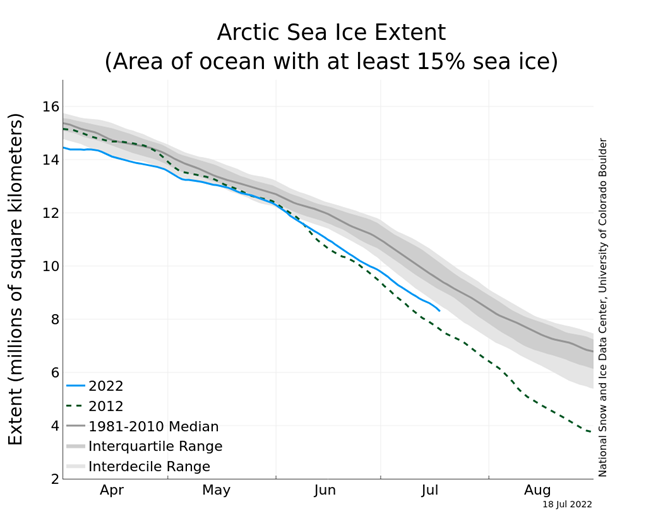
Processing data is pretty common. I mean we aren't fucking idiots. If you can figure out an issue in 2 seconds, you bet it has been addressed. Other sources are just other blog posts so forgive me for not taking them as good value given that I can read articles from scientists and understand all their methods and models (which are open sourced[2]). I mean even the blog you linked me has a graph of arctic sea ice[1] (also addressed in other comment) where they didn't even bother to remove the 1981-2010 mean line. Which both years are below... But if you look at my comment[0] you'll also see why their selection (especially of the time range in months) is deceptive. I walk you through how to verify yourself. It is fine if you don't believe the NOAA data, but if you don't then you also can't believe dailysceptic since they are using that same data to dispute NOAA's claims. Both are dependent on the data being accurate. Which a big irony given our above discussion.
To be more direct with satellite data (because I'm guessing you aren't going to read the arstechnica article), satellites don't measure temperature, they measure brightness. That is then turned into temperature. But they also don't measure ground temperature. So you're biased to that. But this can of course be adjusted and corrected for. But again, if we can do that for satellites why can't we do it for airport thermometers? The reasoning just doesn't line up in a consistent fashion.
I can tell you're really passionate about the subject. I congratulate you on that. We need passionate people and in no way do I want to get rid of your passion. You're trying to seek truth, and that is honorable. But an important part in science and truth seeking is to become your own adversary. Once you feel that an idea is good you have to attack it pretty fucking hard. You can't be sad when things get knocked down, it is just part of the process. You take what's left and rebuild from there and repeat. You need to challenge your own viewpoints. If there is nothing to convince you that would cause you to change viewpoints (even in the hypothetical!) then you aren't actually seeking truth, you're seeking validation.
So if you're seeking truth and you are acting in good faith, tell me just one precise thing that would get you to change your mind if the data suggested. I'll go first: I would doubt the weather models if I saw a constant or increasing trend of arctic sea ice that was outside variance levels.
[2] https://berkeleyearth.org/archive/about-data-set/ (btw, their skeptics guide also addresses all these issues. I hate to break it to you, but these are the same talking points from skeptics over the last decade. So it tends to be fairly easy to refute because noting additional has to be done. Just reapply the previous method to the newer data)
Your posts are quite confusing, do you realize that? I started a reply asking if you had mixed up different locations in the thread, because it seemed like none of the stuff you were writing was connected with the topic or people being discussed. Now I look carefully you seem to have gone off on a tangent and started replying, without any setup or intro, to random other parts of the linked articles, instead of treating them as a citation for the claims being made and sticking to that. I was like, Anthony Watts? Huh? Why is he suddenly appearing? What report? What are you talking about? Going back it seems you've picked a fight with paragraph 9 in the second link when the relevant information for answering your query is in paragraph 1?!
We can discuss other unrelated stuff, that's fine. But please accede first to these three requests:
1. Let's resolve the RAF Coningsby discussion before moving on. You appear to have mis-read the initial claim and then decided it didn't make sense and asked for sources. You now have the evidence. As you don't mention RAF Coningsby or the record breaking temperature in your reply, is it OK to assume you accept that evidence and thus that this reporting problem is real and did in fact occur as stated?
2. Please make it clear what the heck you're actually replying to! Quotes would avoid a lot of confusion here. Remember that some of these articles came out a year ago and I dug them up to satisfy your request for sources, I don't remember every single sentence in them by heart.
3. Finally, please cut out the attempts at philosophical lessons. You seem to be a climatologist, from your posts saying "we" when talking about that group? If so then that's a small community and one with a poor track record of accepting when its theories and evidence have been successfully knocked down by others. Before lecturing others about epistemic humility and truth seeking you may wish to take on Mann and other famous grifters that clutter up the scientific landscape, before random internet commenters of no note or impact.
Moving on.
> If you know the direction it is biased, you can unbias it. Processing data is pretty common. I mean we aren't fucking idiots. If you can figure out an issue in 2 seconds, you bet it has been addressed.
If you know the direction and magnitude of the bias, which the Met Office clearly do not, and if the bias is constant and well characterized, etc. That's important! As you seem to have accepted by choosing to debate something different, climatological agencies are happy to report momentary blasts of jet exhaust as evidence of climate change. That's an issue that literally anyone can figure out in two seconds the moment they discover the thermometer isn't in the village as claimed, but rather right next to a place jet fighters take off, and yet, unambiguously, the Met Office had not figured this out. They even claimed they'd used a rigorous verification process!
So please forgive us if we assume that you guys are in fact not addressing issues that any "fucking idiot" can spot in two seconds, because this would seem to be one of them.
More generally, your field's attitude to data quality is guaranteed to create train wrecks like this. If your data is poor quality you often won't know how to characterize the corruption, which is exactly why good scientists obsess over how to collect data with high quality instruments and setups in the first place. They don't just scrape whatever data they find on the internet and then assume with 100% confidence that 100% of the measurement error both can be well characterized and actually will be. That's an absurd methodology that is guaranteed to lead to continuous disasters like this, as well as the entirely reasonable lack of trust when people discover that you constantly rewrite the historical record. You guys can't even change the data once, you keep doing it, meaning that the vast majority of the climate literature is based on measurements you later decided were wrong! Most of the climate literature should have been retracted by now! This is inevitable when you can't reliably characterize measurement error. Thermometers aren't advanced tech and it's easy to build networks to a standard that satisfies even critics so why do you persist in "fixing" and then constantly "refixing" corrupted data sets?
I'm sorry, this conversation won't continue. Good faith is needed and it is required that you actually also read the sources you link. Good faith is also a requirement of the site. Otherwise you'll be confused as to what I'm responding to, as has happened.
I'm trying my best to "argue in good faith", but if you want to change the topic or respond to different parts of an article than what's relevant to the topic it's really helpful to clarify that. I did figure it out, but it'd have been faster if things were clearer.
Feel free to not respond to any of the points made, but the arguments so far are in good faith. If you think they aren't then the problem is on your side.
The topic hasn't changed. I'm just getting down to the root of where your arguments come from. That's why it looks a bit different. If you're arguing about the health of a tree by nature of the leaves and I am saying that the roots and foundation are problematic then the conversation will look different. The articles you reference, and thus where your evidence for your claims come from, have self inconsistencies and claims that are verifiably false. Look back at what I have said from this lens. Look back at what you have linked and actually read (or reread) the articles for more context. I put in the effort to read everything you sent me, it would necessitate that you do so in kind (including your own sources. I mean if you link me things that aren't relevant then of course we'll digress, but that mistake is on you, not me. You have even demonstrated this by admission of the confusion about Watts).
I want to also clarify that good faith doesn't just mean that you have good intentions. The bar is far higher than that. You have to have a willingness to change opinions given countering evidence. You have to do your best to interpret my words as to their intended meaning, not to the literal (because language is fuzzy and imprecise). It does require you to take time and process to the best of your ability, to ask for clarification where you are confused. But I assure you that everything I have wrote is not only connected to the responses, but strongly so. If you can take time to see this then you'll demonstrate good faith. But if you also do so then the conversation need not continue further anyways. So that's kinda where we'll stand because frankly I don't have the energy to continue. You can put that on me. But maybe you should attempt to understand why that is so.
Well, I haven't yet seen you change any of your opinions, but obviously that isn't proof you're unwilling, so I don't think trying to figure out other people's willingness is very productive. How would anyone ever know? If someone is putting in the effort to cite sources and defend their position, it makes sense IMO to assume a default of good faith argumentation. The alternative is a kind of nihilism. Indeed, I'm willing to continue. It's you who aren't! So, who is most willing to change their views?
Let's agree that our disagreement here stems originally from a disagreement over the nature of citing sources. I'd prefer to discuss the original claims (the leaves, as you put it), or at least finish discussing them, with the source excerpts being there to back up those claims only. You'd prefer to debate the entirety of the sources themselves as part of determining the validity of the original claims. Am I right in understanding this is because you don't (yet) believe the specific claims about the airport, the logbooks, etc? Or do you accept that this problem did occur and now wish to have a broader debate? Also how wide does this go? Will you bring up non-cited articles by the same author? Non-climate articles on the same site?
Getting more towards the roots. There seem to be three "branches" of this tree. (1) the RAF airport, I believe this has been proven conclusively unless you think Morrison is inventing FOIA requests and things out of whole cloth so let's put that to one side now, (2) data adjustment vs improved instrument quality and (3) the sea ice chart.
I've already laid out my views (and those of zacharees I guess and lots of other people) when it comes to (2). We don't accept the idea that scientists should just suck up data of arbitrarily low quality, do some processing and then demand the public blindly trusts that the data is fixed. Jet exhaust spikes being declared climate change are clear evidence that this fixing process doesn't work properly, but there's also a logical circularity issue. Anyway. No need to repeat all that as I wrote it out above.
That leaves (pun intended har har) (3) the sea ice chart. It helps to have context here about what Morrison believes. His line is that global warming was real, but "started to run out of steam 20 years ago" as he put it. He thinks that CO2 saturates i.e. climate response isn't linear but logarithmic and that whilst there was indeed some industrial warming in the 20th century, in the last 20 years most impact on temperatures has been a mix of natural factors like El Ninos and poor data handling by climatologists. The 1980-2010 trend line remains because, firstly, climate skeptics don't like tampering with charts! These charts are generated by government provided websites and the standard in that community is to use the generated images as-is. And secondly, because it doesn't contradict his views on what's happening. Indeed he calls it out specifically, "As can be seen in the graph above, the decline rate of the sea ice extent is not far off the 1981-2010 average and well above 2012" so I don't understand why you say he didn't even remove it. Why would he? He goes on to talk about natural cycles and the AMO/PDO, so it's a part of his argument. The chart supports that view because if sea ice were driven purely by human activity (the standard line we're fed) then sea ice should continue to decline year-on-year but there's been no effect from the last 10 years of emissions, apparently. So clearly natural variation is dominating here.
> You'd prefer to debate the entirety of the sources themselves as part of determining the validity of the original claims.
No, because I'm discussing the data. That's why it is the roots. My claim about the sources you mentioned are the stalk, which is rotten. Because they are misinterpreting or misunderstanding the data and making conjecture that isn't validated. I haven't really discussed (1) but I've extensively discussed (2) and (3).
Did you actually look at the data or just immediately Google for a rebuttal? The page you link to asserts there to be a trend, but then links back to the page I linked to, which:
a. Doesn't plot trend lines. What are they trying to link to, exactly?
b. Has no observable trend in it. You can see that with your own eyes.
Look at the graph!
BTW, in the text there's a claim there's a trend but, "the warming rate (trend) in USCRN annual temperatures is 0.86°F per decade, with uncertainties ranging from -0.58°F to 2.31°F per decade."
In other words the trend is so tiny the uncertainty bound includes zero, which means they can't actually say if there's a trend at all. It might even be going down. This is all another way to say there's no observable problem in this data. It's called global warming, but in the country with the best temperature network it doesn't happen.
> A couple of decades ago this problem flared up in the US and Congress spent the money to build out a new state of the art weather station network
> For nearly 20 years it's shown no warming in the USA whatsoever.
i.e. since the construction of a high quality network, warming doesn't happen anymore.
If you zoom out to the 1950s you're incorporating data from the old network. The US government built a new one because data from the old network was being extensively modified by climatologists post-collection, and they were even modifying data long in the past, using the low quality of the network as a justification for doing so. More than half of all observed warming comes from these administrative adjustments and aren't actually visible in the original data, so you can see why you'd want to fix that.
With all due respect, you can't claim half a dozen links are compromised of "invalid data" if you're not going to provide a proper source that states this data is invalid. You are a single commenter on HN, why would anyone read your posts and then invalidate the entirety of modern climate science? You need to give a little more to go off here.
The sources have been posted and you can see for yourself that the climate sensors are located at the tarmac airports, many in the pathway of airplane exhaust jets.
What you are looking for are “authoritative” analysis from the same in group perpetuating this scam, which is circular reasoning and a logical fallacy.
Many authoritative sources outside of this club are rightly pointing out with hard data that this warming is so overstated, fraught with integrity problems (to put it lightly) and conflicts of interests that the entire narrative needs an audit and inclusion of climate scientists that have been locked out of this debate.
Sorry, it's easy to forget that many people have never encountered these facts before. Climatologists continuously rewrite history which is why it's so confusing. In 1999, NASA climatologist James Hansen was wondering why the USA hadn't got any warmer in the 20th century:
This is a very interesting historical article which NASA has long since deleted from their website. Look at the two graphs, in particular the graph of US temperatures on the left. The text says this:
How can the absence of clear climate change in the United States be reconciled with continued reports of record global temperature? Part of the "answer" is that U.S. climate has been following a different course than global climate, at least so far. Figure 1 compares the temperature history in the U.S. and the world for the past 120 years. The U.S. has warmed during the past century, but the warming hardly exceeds year-to-year variability. Indeed, in the U.S. the warmest decade was the 1930s and the warmest year was 1934.
OK, so in 1999 the historical record said there was no clear climate change in the USA and the hottest year was 1934. Temperature declined from +1.5F (anomaly) to about -0.2F in 1970. Now look at the modern NASA temperature graph:
If you look at the 1900-2000 period in both graphs, the story is very different. Now 1999 is hotter than 1934. In the old graph, the period between 1980 and 2000 doesn't do much. In the modern graph you see rapid warming.
So what's going on? As you can see, by the year 2000 climatologists were getting seriously bothered by the US data. It can't really be called global warming if it isn't global. Also, the US temperature network had a lot of problems but it is by far the most comprehensive for 20th century data. Much of the world doesn't have any data at all for much of the 20th century! Theory and observed data didn't match, so they went looking for reasons to change the data. If you look hard and long enough you can find such reasons, and they had plenty of time. The weather stations were never intended for climate monitoring so their siting and procedures weren't good enough for that. More and more adjustments started being made until the picture you see today: they cooled the dustbowl years and warmed the most recent history. Fast forward 20 years and they're so comfortable with changing historical data that some temperature records rewrite the entire history of every thermometer reading, every month.
This isn't really kosher, obviously, hence the construction of the new Climate Reference Network. Unlike the historical network this one is built for climatologists, with very careful siting away from heat sources. It shows no warming. So to recap: in 1999, the weather stations show no warming in the 20th century. A few years later a new network opens, and it shows no warming either. The appearance of warming comes from big piles of FORTRAN that reprocess the old data. Although this is about the US data, the global thermometer network has even bigger problems with siting, rewritten histories etc.
Hopefully that's enough to go on, if you feel like researching the topic further!